The Enterprise Dashboard is the web-based interface to the Service Manager. The procedure for starting the dashboard is identical for all platforms. From the dashboard, you can configure the settings necessary for receiving updates from MySQL Enterprise.
If you installed the Service Manager using a graphical interface, you have the option of launching the dashboard on the final installation screen (as long as the checkbox is checked).
Otherwise, you can view the dashboard by typing
http://localhost:
into the address bar of your web browser. To see the host name and
port to use, check the
18080/Auth.actionconfiguration_report.txt file.
Under Windows, you can also open the dashboard by choosing the
MySQL menu item and finding the
MySQL Enterprise Monitor entry. Under this entry, choose
Start Service Manager.
If this is the first time logging in to the dashboard, you see a screen similar to the following:
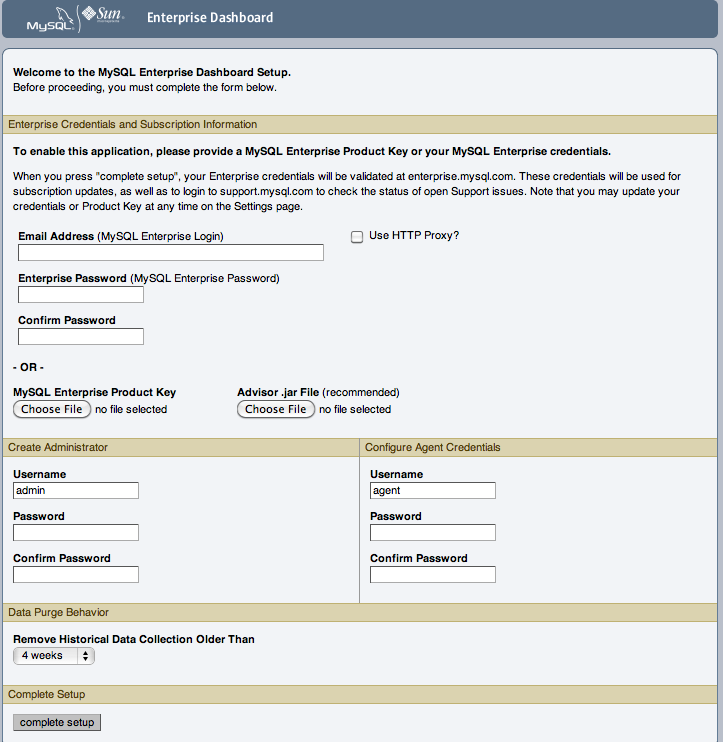
Use this screen to perform the following tasks:
Set up your MySQL Enterprise credentials.
Set up your My Oracle Support credentials.
Create a user name and password for the dashboard administrator.
Create a user name and password for the Monitor Agent.
If you have been provided with an Advisors file, click the
button and locate these files. The
advisor file is named,
AdvisorScript-.
If you do not allow Internet access from the dashboard, you must
install the advisors in this way. It is strongly recommended
that you install the Advisors at this point, but you may also do
so later. For instructions on doing this, see
Section 15.6.2.7.3, “Installing, Updating or Upgrading Advisors After Initial Login”.
version.jar
If you have Internet access from the dashboard, activate
MySQL Enterprise Monitor by supplying your MySQL Enterprise credentials. Enter
your email address as the MySQL Enterprise
Login and enter and confirm your MySQL Enterprise
password. If you specify incorrect credentials, you receive the
error message “Unable to connect to verify
credentials.”
In the Create Administrator section of this
screen, enter credentials for the dashboard administrator. This
creates the root user described in
Section 15.6.1.3, “Users Created on First Log-in”. Record the user
name and password, as these credentials are required for any
future login.
In the Configure Agent Credentials section
of this screen, enter the credentials for the agent. This is the
agent user also described in
Section 15.6.1.3, “Users Created on First Log-in”. The agent must
log in to report its findings. Record the agent's credentials;
this information is required when installing the agent.
After specifying all settings, click the button. When you log in, a message reports how many graphs and advisors were imported.
If importation of the advisor files fails, you see the message:
Unable to import Advisor Jar. You may download the jar
manually from the Enterprise Portal and import it from the 'Check For Updates' page.
In this case, download the advisor file from the Enterprise website and install it as described in Section 15.6.2.7.3, “Installing, Updating or Upgrading Advisors After Initial Login”.
If this is the first time that you have launched the dashboard, you are asked to set your time zone and locale. Choose the appropriate values from the drop-down list boxes. Setting the time zone ensures that you have an accurate time reference for any notifications from the MySQL Enterprise Advisors.
Make sure to set the time zone (and the system clock) correctly because this setting affects the way the graphs display. To change the time zone or locale, see Section 15.8.2, “User Preferences”.
The locale chosen determines the default language displayed when logging in to the Dashboard. This overrides the default browser settings whenever this specific user logs in.
After specifying your time zone and locale, the dashboard opens on the Monitor tab. For a detailed examination of the Monitor Screen, see Section 15.7, “MySQL Enterprise Dashboard”.
The Advisors interpret the data sent by the Monitor Agents and display the results in the dashboard. A full set of Advisors is preinstalled with the Service Manager. You can download any new or updated Advisors from MySQL Enterprise.
If you did not install the Advisors when you first logged in to
the MySQL Enterprise Dashboard, open the dashboard, find the
Advisors tab, and choose the Check
for Updates link. Doing this downloads the latest
version of the Advisors from the MySQL Enterprise web site. To
install the advisors in this fashion, specify your MySQL
Enterprise credentials. Find instructions for doing this in
Section 15.8.1, “Global Settings”.
If you do not allow Internet access from the dashboard, install
the Advisors from a local file. You need an advisor file named
AdvisorScript-.
If you do not already have this file, download it from the
MySQL Enterprise downloads page. Download the Advisors file to
a location that is accessible from the dashboard. Use the
button to find the Advisors file
and then choose to load the
advisors.
version.jar