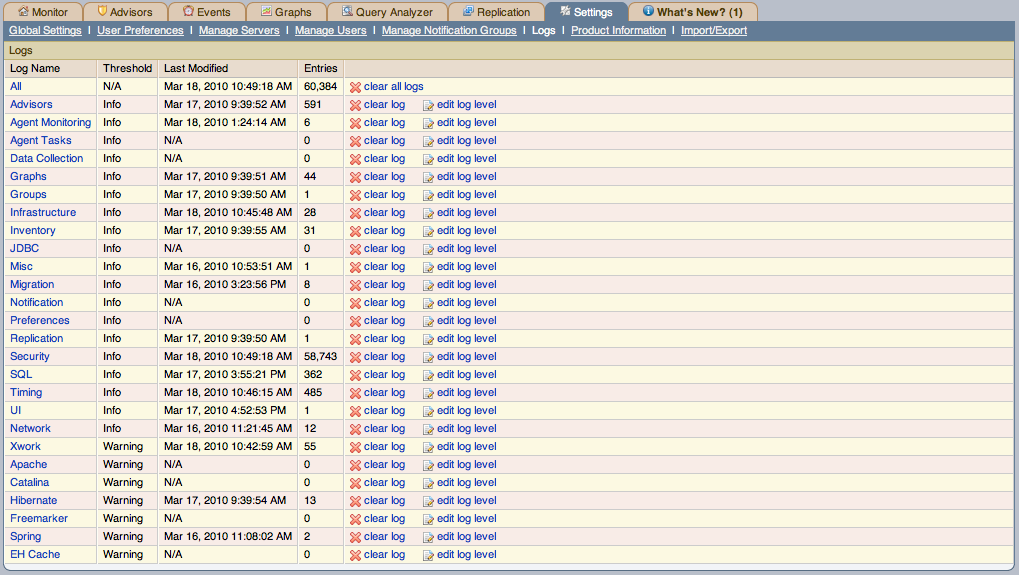
Use the Logs link to inspect the various log
files associated with the MySQL Enterprise Service Manager. The following image is
an example of this screen.
The various categories of logs are shown in alphabetic order. The most recent changes to each log are shown in the Last Modified column. The number of entries in any specific log is shown under the Entries column.
To view detailed information click the Log
Name. This opens a separate browser window showing the
date, time, alert type, and accompanying message.
On this screen you can filter log information in a couple of ways; by the message type and by time period.
To filter by message type select from the options in the level drop-down box. These are, in order of decreasing severity:
All
Error
Warning
Information
Trace
Debug
You can also adjust the number of items that appear on each page.
Press the clear all logs link to remove all log
entries. To remove entries of a specific kind click the
clear logs link associated with the specific
log. A confirmation dialog box lets you back out of this operation
and avoid accidentally removing log information.
To clear log files of a specific age see the Data Purge
Behavior section of the Global
Preferences page. For more information on this topic see
Data Purge Behavior.
Use the edit log level link to change the type
of error logged. The value selected from the Edit Log
Level dialog box determines what appears under the
Threshold column (second from the left in
Data Purge Behavior).
Selecting Error from the list box creates the
least number of log entries and Debug the most.
Choosing None turns off logging altogether.
It is also possible to download a compressed version of all the log files. For more information, see Section 15.8.7, “Product Information”.
