You can obtain a list of the currently monitored servers connected to the MySQL Enterprise Service Manager, and details of the current version and key configuration by using the Manage Servers tab.
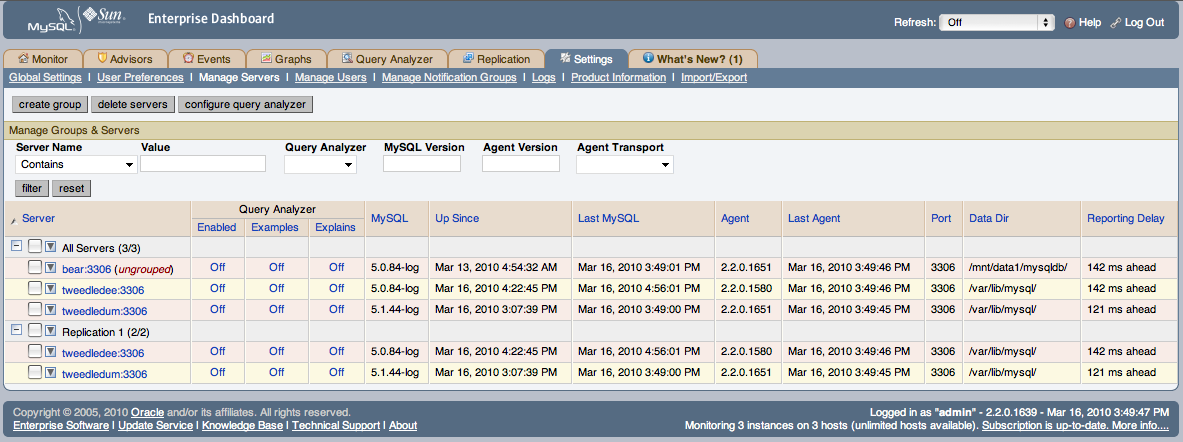
The Manage Servers tab provides a list of servers, organized by groups, in a similar fashion to the main server navigation list. For each server, the following information is displayed:
Query Analyzer
Shows the Query Analyzer configuration for the server, showing whether Query Analyzer is enabled, whether the recovery of example queries is enabled, and whether explain plans for queries have been enabled.
From this display, you can also control the Query Analyzer settings for each server by clicking the link for each server to change the settings. This brings up the Configure Query Analyzer pop-up window. For more information, see Query Analyzer Settings.
MySQL
Shows the version number of the MySQL server being monitored.
Up Since
Shows the time when the MySQL server was started (the server up time).
Last MySQL
The last time communication with the MySQL server occurred.
Agent
Shows the version number of the MySQL Enterprise Agent server being monitored.
Last Agent
Shows the last time communication was received from the agent.
Port
The configured MySQL port number.
Data Dir
The data directory path for the MySQL server.
Reporting Delay
The time between when the data was obtained by the agent when it was received by MySQL Enterprise Service Manager.
You can search and filter the server list by using the fields and pop-ups at the top of the list. You can filter using one or more of following techniques:
To filter by server name, select the match type (Contains, Regex, Doesn't Contain, or Negative Regex), and enter a string or regular expression into the Value field.
To filter based on whether the Query Analyzer functionality has been enabled or disabled, use the Query Analyzer pop-up.
To filter by MySQL server version, you can enter either an explicit version number into the MySQL Version field, or you can additional symbols to restrict the versions to different ranges. The field supports the following statements:
Statement Example Description Version Prefix 5.0Shows all MySQL servers matching the specified version. For example, 5.0matches any version of MySQL from 5.0.0 to 5.0.99Explicit Version 5.0.84,=5.0.84Shows all MySQL servers matching the specific version number. > Version > 5.0.84Shows all versions greater than the specified version. >= Version >= 5.0.84Shows all versions greater than or equal to the specified version. < Version < 5.0.84Shows all versions less than the specified version. <= Version < 5.0.84Shows all versions less than or equal to the specified version. String enterprise,logShows all servers with the specified string in their version ! String or Version !enterprise,!5.0.84Shows all servers not having the specified string, or not matching the specified version. You can combine multiple arguments to produce more complex formats. For example, to list all of the servers of 5.1 or higher that do not have enterprise in the version string, you could use
>=5.1 !enterprise.Agent Version
Filters the list based on the MySQL Enterprise Agent version number. This can be useful if you want to know which means require an upgrade to a later version. The Agent Version field supports the same selection criteria as the MySQL Version field, allowing to select based on specific version numbers and strings.
Agent Transport
Filters the list based on the protocol the Agent uses to communicate with the MySQL Enterprise Service Manager. You can select either standard HTTP or HTTPS/SSL-based connections.
After you make you selection, use the button to filter the server list. To reset your selections to show everything, click .
Using the list of servers, you can create groups to more easily manage and monitor your servers according to the departments, applications or other groupings that you may want to use. For information on how to create and modify groups, see Section 15.8.3.2, “Grouping Servers”.
You can also perform simple administration on the server within the MySQL Enterprise Monitor framework, including configuring the Query Analyzer, renaming the server (as it appears within MySQL Enterprise Service Manager) or the group name, and updating the information about the server (re-inventory). All of these operations are handled by using hovering over the triangle next to the server name or group.
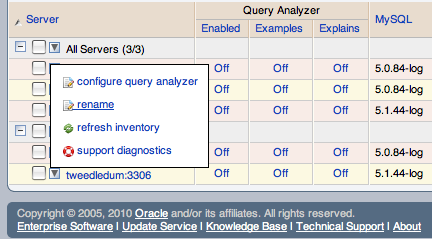
The pop-up provides a list of options, which are different depending on whether you have selected an individual server or a group. For the group, you can only rename the group, delete the group, or obtain a bundled version of the support diagnostics information. For individual servers, you can modify the Query Analyzer configuration, rename the server, refresh the server inventory, or obtain the support diagnostics information.
To change the configuration of the Query Analyzer for the server, see Query Analyzer Settings. This option is not available for a group.
To rename a server choose , or to rename a group, choose . For information on renaming a server, see Section 15.8.3.1, “Renaming a Server”. To rename a group, you can change change within the pop-up prompt provided.
To re-inventory your MySQL server and update version and configuration information, click the triangle and choose . This triggers an update of the server information without affecting the schedule inventory process. You can use this when you have upgraded or made significant configuration changes to your server to update the inventory and ensure that the correct rules and advisors are being executed on your server.
You can obtain the support diagnostics file for either individual servers, or entire server groups. To get a diagnostic report file, select from the pop-up menu. The information is provided as a Zip file that is downloaded to the machine. The information contained in the report includes detailed information about your server (or multiple servers if you selected a server group), including configuration, hardware, MySQL options/variables and historical graphs. To view the information extracted, unzip the downloaded file and double-click the
index.html.For generic information about your MySQL Enterprise Monitor installation, see Diagnostic Report.
NoteRenaming a server using the Manage Servers tab overrides all other settings, including changes made within the agent configuration.