Table of Contents
- 15.1. MySQL Enterprise Service Manager
- 15.2. MySQL Enterprise Dashboard
- 15.3. MySQL Enterprise Advisor Collections
- 15.4. Monitored MySQL Server
- 15.5. MySQL Enterprise Agent
- 15.6. Installation Reference
- 15.7. MySQL Enterprise Dashboard
- 15.8. The Settings Tab
- 15.9. The What's New Tab
- 15.10. The Advisors Tab
- 15.11. The Events Tab
- 15.12. The Graphs Tab
- 15.13. The Query Analyzer Tab
- 15.14. The Replication Tab
- 15.15. MySQL Enterprise Monitor General Reference
- 15.15.1. MySQL Enterprise Monitor Limitations
- 15.15.2. Supported Browsers
- 15.15.3. Installation Requirements
- 15.15.4. Configuring Tomcat Parameters
- 15.15.5. Backing up MySQL Enterprise Service Manager
- 15.15.6. Migrating 1.3.x Historical Data to MySQL Enterprise Monitor 2.0
- 15.15.7. Improving Disk Space Usage with Purge in 2.1 and 2.2
- 15.15.8. Regular MySQL Enterprise Monitor Maintenance
- 15.15.9. Advisor/Graph Reference
- 15.16. MySQL Enterprise Monitor Frequently Asked Questions
MySQL Enterprise Monitor is an enterprise monitoring system for MySQL that keeps an eye on your MySQL servers, notifies you of potential issues and problems, and advises you how to fix the issues. MySQL Enterprise Monitor can monitor all kinds of configurations, from a single MySQL server that is important to your business, all the way up to a huge farm of MySQL servers powering a busy web site.
This section describes the basic components that make up the MySQL Enterprise Monitor product. These components can be installed in various configurations depending on your own database and network topology, to give you the best combination of reliable and responsive monitoring data, with minimal overhead on the database server machines. A typical MySQL Enterprise Monitor installation consists of:
One or more MySQL servers that you want to monitor. MySQL Enterprise Monitor can monitor both Community and Enterprise MySQL server releases.
A MySQL Enterprise Agent for each monitored MySQL server.
A single MySQL Enterprise Service Manager, which collates information from the agents, and provides the user interface to the collected data.
The structure of a typical MySQL Enterprise Monitor installation is shown in the figure below.
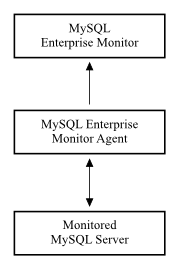
MySQL Enterprise Monitor is designed to monitor one or more MySQL servers. The monitoring information is collected by using an agent, MySQL Enterprise Agent. The agent communicates with the MySQL server that it monitors, collecting variables, status and health information, and sending this information to the MySQL Enterprise Service Manager. If you have multiple MySQL servers, then you have multiple MySQL Enterprise Agent processes monitoring each MySQL server. The MySQL Enterprise Agent has other responsibilities and capabilities, which we describe in more detail later in this chapter.
The information collected by the agent about each MySQL server you are monitoring is sent to the MySQL Enterprise Service Manager. This server collates all of the information from the agents. As it collates the information sent by the agents, the MySQL Enterprise Service Manager continually tests the collected data, comparing the status of the server to reasonable values. When thresholds are reached, the server can trigger an event (including an alarm and notification) to highlight a potential issue, such as low memory, high CPU usage, or more complex conditions such insufficient buffer sizes and status information. We call each test, with its associated threshold value, a rule.
These rules, and the alarms and notifications, are each known as a MySQL Enterprise Advisor. Advisors form a critical part of the MySQL Enterprise Service Manager, as they provide warning information and troubleshooting advice about potential problems.
The MySQL Enterprise Service Manager includes a web server, and you interact with it through any web browser. This interface, the MySQL Enterprise Dashboard, displays all of the information collected by the agents, and lets you view all of your servers and their current status as a group or individually. You control and configure all aspects of the service using the MySQL Enterprise Dashboard.
The information supplied by the MySQL Enterprise Agent processes also includes statistical and query information, which you can view in the form of graphs. For example, you can view aspects such as server load, query numbers, or index usage information as a graph over time. The graph lets you pinpoint problems or potential issues on your server, and can help diagnose the impact from database or external problems (such as external system or network failure) by examining the data from a specific time interval.
The MySQL Enterprise Agent can also be configured to collect detailed information about the queries executed on your server, including the row counts and performance times for executing each query. You can correlate the detailed query data with the graphical information to identify which queries were executing when you experienced a particularly high load, index or other issue. The query data is supported by a system called Query Analyzer, and the data can be presented in different ways depending on your needs.